Furnace Monitoring
Furnace Monitoring
Efficiency and safety are key parameters when operating furnaces in smelting plants. Sustainable operation includes minimizing energy usage and emissions while increasing production and to work in such a way that people are safe and not exposed to unnecessary hazards.
Today, many smelting processes are monitored and operated based on temperatures from infrequent dip samples. This poses some challenges both in terms of the quality of the information available and the safety of the people working in the plants:
- Manual samples are taken infrequently, and only provides a snapshot of the temperature. It is difficult to know if the samples are representative over a time period, or if they happened to be outliers i.e. higher or lower than what is actually the case.
- Samples are usually done at only one location inside the furnace. This is also a cause of error, if the temperature distribution is not even over the whole furnace, e.g. colder solids being close to where the sample was taken.
- Manual sampling involves people being in close proximity to molten metal, which is a major safety risk with potentially fatal consequences in the case of an accident.
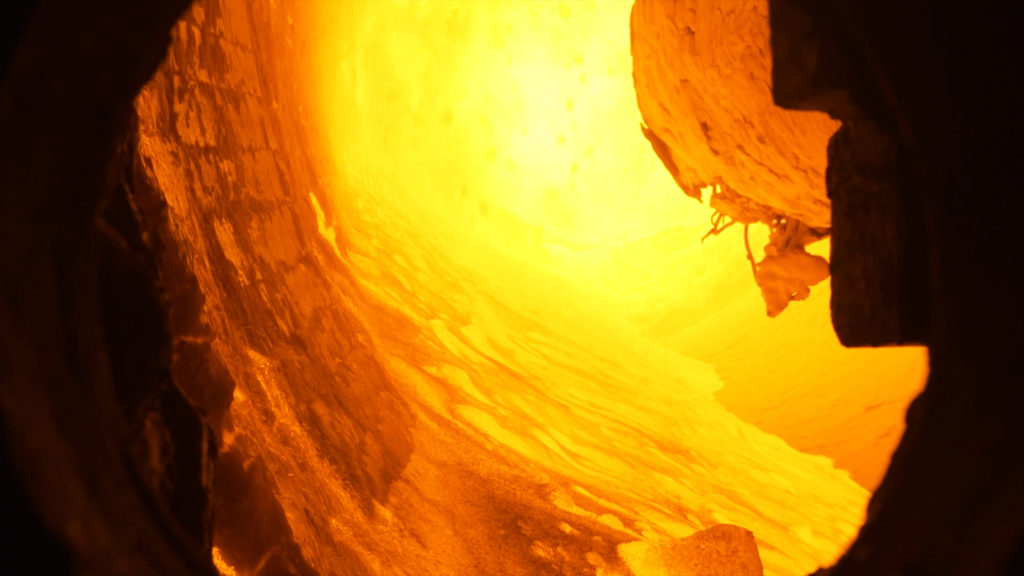
Idletechs offers a Furnace Monitoring solution that monitors furnaces using thermal imaging and transparent machine learning methods that provides users with continuous temperature measurements and other key information for the most efficient operation. Our solution provides robust continuous temperature measurements by analyzing thermal images in real time and calculating the correct temperature of the melt by using information from the whole image and not only single points that are susceptible to disturbances.
By using thermal imaging instead of manual dip measurements, we remove people from hazardous areas and at the same time provide a full overview of the whole inside of the furnace every single second.
The benefit of using a thermal imaging is that the whole inside of the furnace is being monitored, as every pixel can be seen as an individual temperature measurement. This gives us information about the temperature distribution over the molten surface as well as the refractory walls. By using thermal imaging, temperature measurements will also be more consistent, as variations from manual sampling due to individual differences from operator to operator and different thermocouples are removed.
When combining this with Idletechs’ transparent machine learning, it is possible to build models that provide the user with online information on the state of the process and the condition of the refractory of the furnace. By using our methods, we are able to find information in the data that are not visible to the naked eye by only looking at the raw thermal images.
Idletechs Furnace Monitoring solution provides:
- User interface with at a glance status
- Robust, continuous temperature measurement
- Alarms for deviations from normal
- Drill down analysis to investigate deviations
- See temperature trends over time
- Compare different points in time
- Compact storage of thermal images, enabling storage of data for long time periods
Benefits:
- Temperature measurement of surface
- Temperature estimation of metal under slag layer
- Detection and quantification of fuming
- See if all solids are dissolved
- Monitor crust formation
- Show slag accretion on lining and lance
- Early detection of refractory wear and defects
- Combine thermal image data to process data
- Remove operators from furnace
Solution
Analysis results and thermal images are available through the Idletechs User Interface. The Home page shows users the most recent information and provides an overview of key information from the system. Other pages show supporting information to understand trends and deviations through more detailed analysis.
Screens
The User Interface consists of five screens. Each provides the user with different visualizations for supporting different tasks.
Home
Main screen, provides users with the most recent information and shows a high-level overview of process state, recent events, and a live view of the thermal image.
Detailed
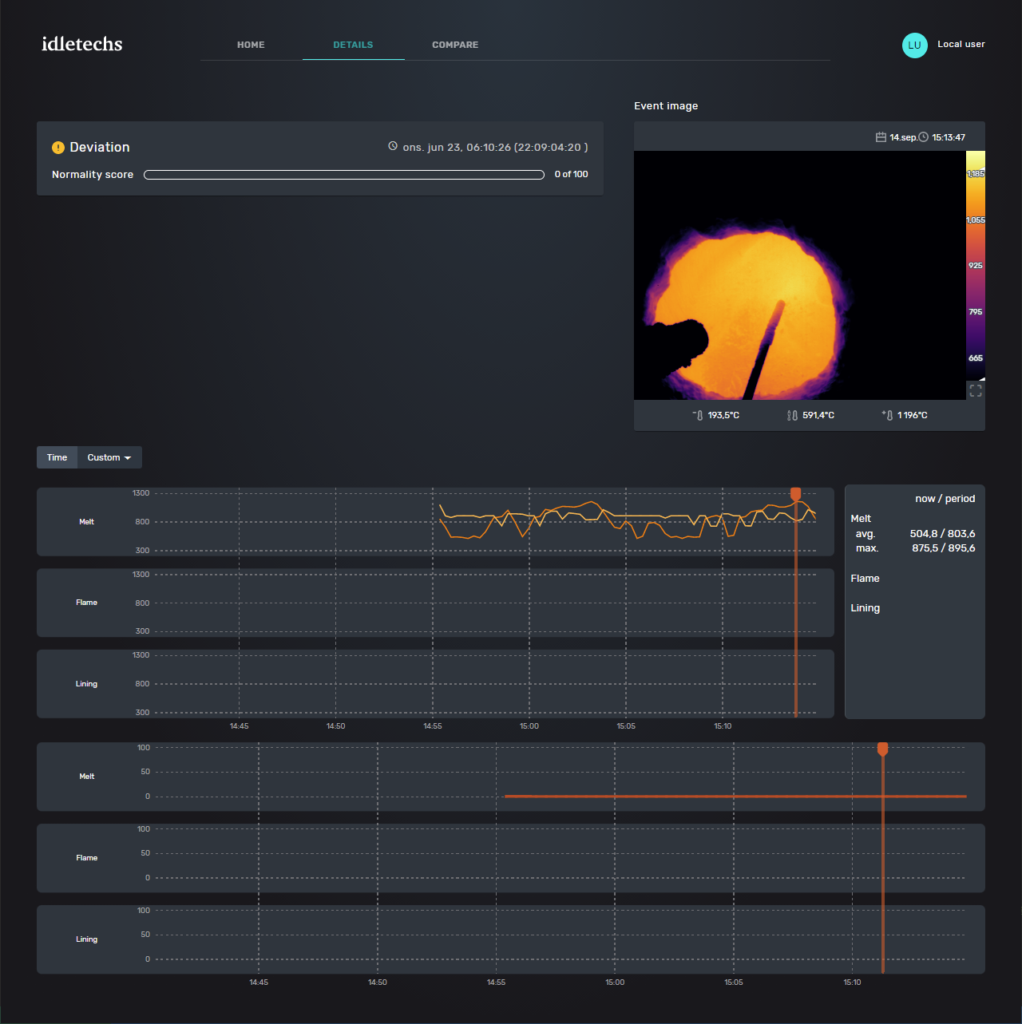
Provides more detailed information on system generated events and the surrounding time frame. Useful for investigating deviations and to add user interpretations.
Compare
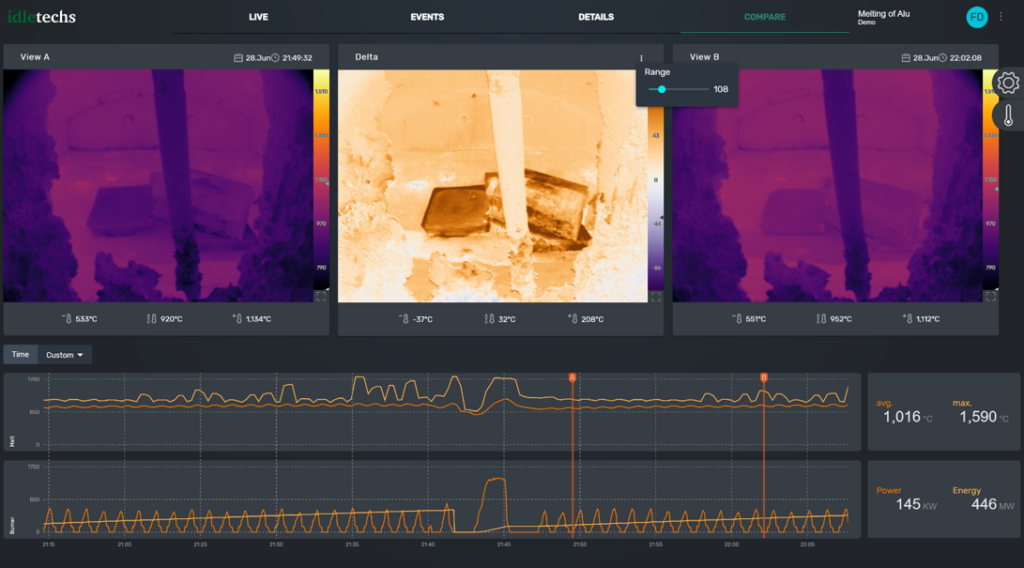
Screen for comparing two points in time. Helps in understanding trends and changes between two points in time.
Help
Supporting documentation for the different elements and concepts in the solution.
Concepts
Normality A value between 0 and 100% that relates the current state to the baseline of what is considered normal behavior. If the state of the equipment drifts away from normal, the normality decreases.
Event A significant change in the state of the equipment. Events are generated by the system if temperatures exceed pre-defined limits or if normality drops.
Event types
Purple Critical, alarm or other dangerous events
Red Large deviation, normality below 25%
Yellow Medium deviation, normality below 75%
Green Normal, normality over 75%