Thermal Condition Monitoring
Thermal Condition Monitoring
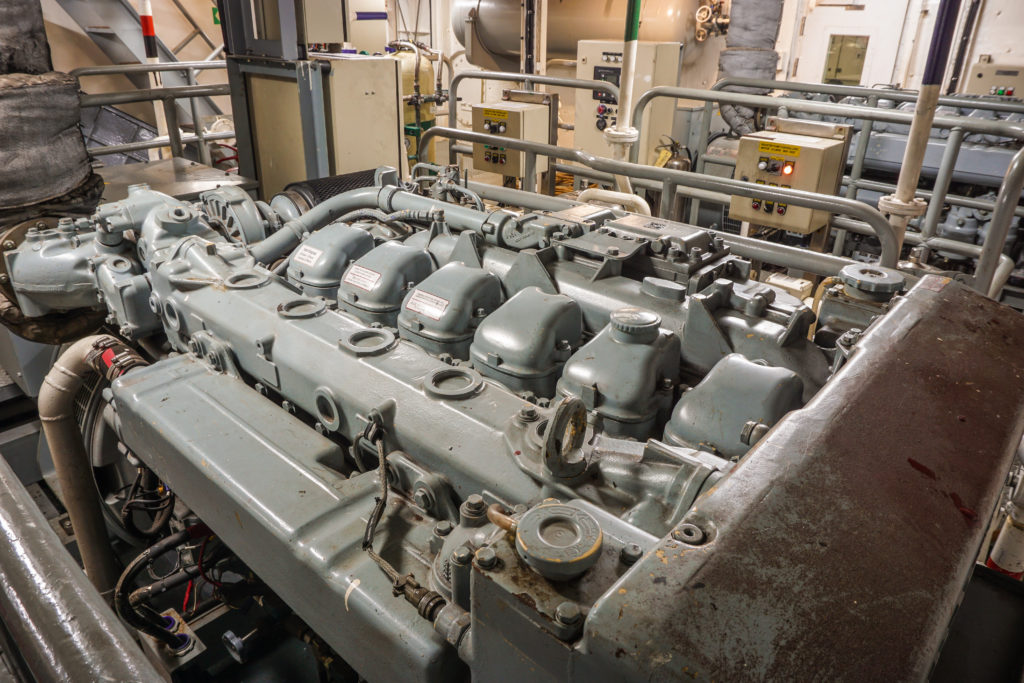
Engines on board fast ferries are operated at high RPM, which causes high component wear and risk for failures. This is today mainly addressed through time-based maintenance (TBM), where components are inspected or replaced after a certain period of time in operation. This can lead to unnecessary maintenance stops and replacement of parts, or that worn parts or other types of defects are not discovered in time, which could lead to accidents, costly wreckages, and long downtimes that could cost the ship owner millions.
Idletechs offers a Condition Monitoring solution that monitors the engine using thermal cameras and transparent machine learning methods that alerts users of deviations at an early stage to avoid critical component failures and provides tools to inspect deviations to improve understanding.
This is done by looking at a combination of the absolute temperatures (any points where temperature exceeds a maximum value) and how temperatures over the whole asset change in relation to each other (temperature of all cylinders should increase and decrease at the same rate).
Idletechs Condition Monitoring solution provides:
-
User interface with at a glance status
-
Analyze thermal video to find patterns in the data
-
Use these patterns to establish a baseline for normal equipment behavior
-
Alarms for deviations from normal
-
Drill down analysis to investigate deviations
-
See trends for temperature patterns over time
-
Compare different points in time
-
Compact storage of thermal images, enabling storage of data for long time periods
With the following effects:
-
Early warning of deviations
-
Reduce unnecessary replacement of parts
-
Improve uptime
-
Better overview and understanding of component health and behavior
-
Facilitate communication between shifts and between crew and technical staff through quantitative equipment condition data
Solution
Analysis results and thermal images are available through the Idletechs User Interface. The Home page shows users the most recent information and provides an overview of key information from the system. Other pages show supporting information to understand equipment behavior and deviations through more detailed analysis.
Screens
The User Interface consists of four main screens. Each provides the user with different visualizations for supporting different tasks.
Home
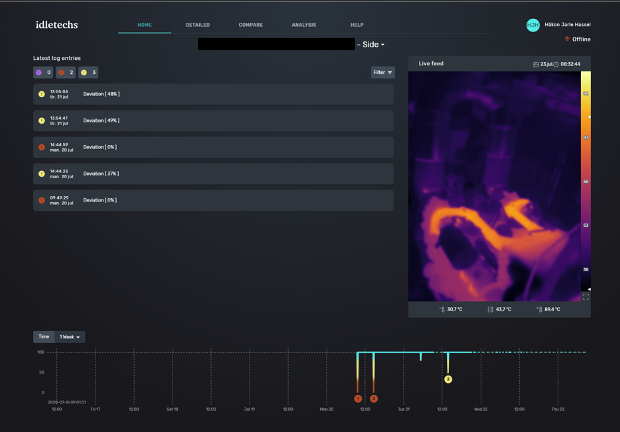
Main screen, provides users with the most recent information and shows a high-level overview of equipment state, recent events, and a live view of the thermal image.
Detailed
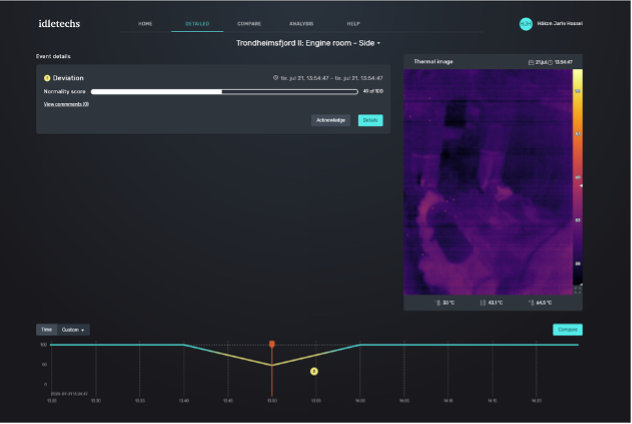
Provides more detailed information on system generated events and the surrounding time frame. Useful for investigating deviations and to add user interpretations.
Compare
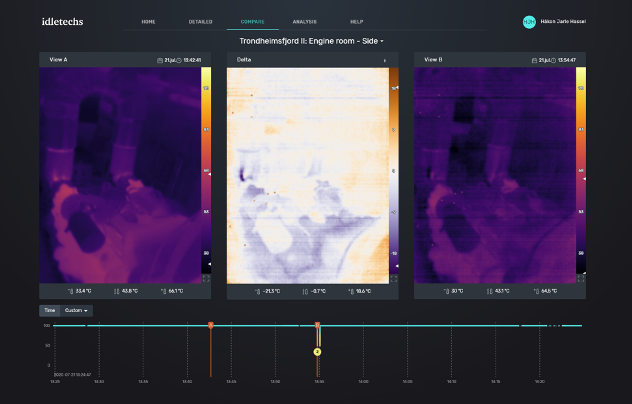
Screen for comparing two points in time. Helps in understanding changes between two points in time.
Analysis
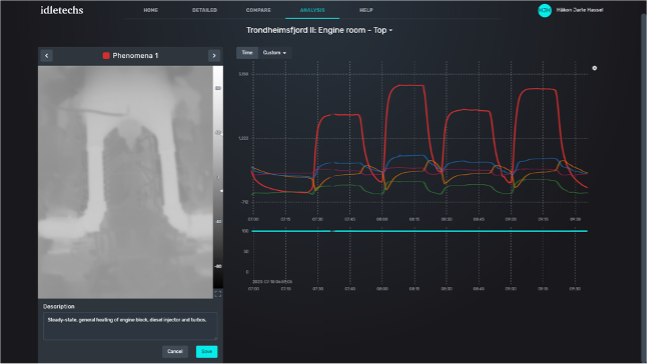
Visualization of thermal patterns in the data and how they develop over time.
Concepts
Pattern: A pattern describes which pixels in the thermal image covary and how they vary in relation to each other (e.g. increase together or in different directions)
Normality: A value between 0 and 100% that relates the current state to the baseline of what is considered normal behavior. If the state of the equipment drifts away from normal, the normality decreases.
Event: A significant change in the state of the equipment. Events are generated by the system if temperatures exceed pre-defined limits or if normality drops.
Event types:
-
Purple: Critical, alarm or other dangerous events
-
Red: Large deviation, normality below 25%
-
Yellow: Medium deviation, normality below 75%
-
Green: Normal, normality over 75%